Results 2023
Bosham School Results 2023
These are our results for the current academic year.
Early Years Foundation Stage (Reception Class)
|
|
Bosham | National |
|---|---|---|
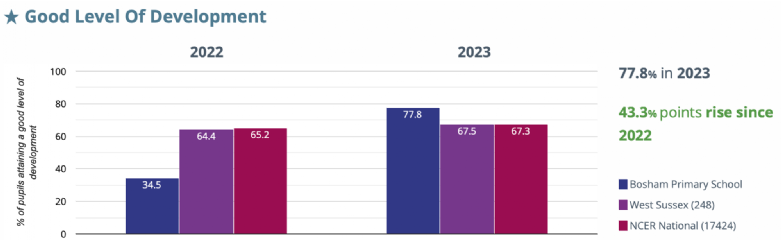
| % of children leaving EYFS with a good level of development in 2023 | 78% | tbc |
|
% of children leaving EYFS with a good level of development in 2022 |
39% |
65% |
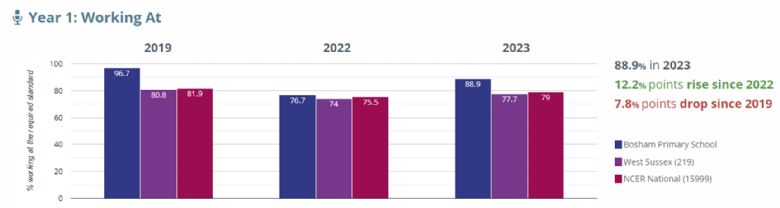
Year 1 Phonics Screening Check
|
|
Bosham | National |
|---|---|---|
| % of children who met the required standard in 2023 | 89% | tbc |
|
% of children who met the required standard in 2022 |
77% |
75% |
Year 2 Phonics Retakes
|
|
Bosham | National |
|---|---|---|
| % of children who met the required standard in 2023 | 93% | tbc |
|
% of children who met the required standard in 2022 |
90% |
87% |
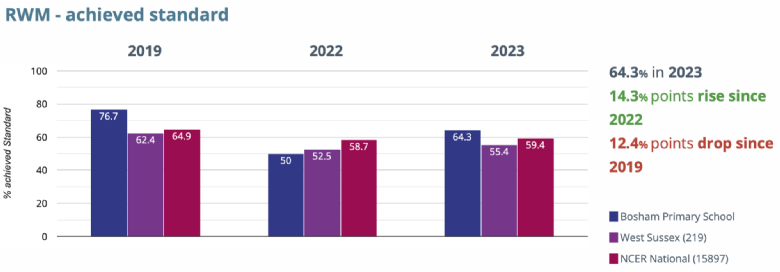
Year 6 KS2 Statutory Assessments
RWM = Combined reading, writing and maths.
|
|
Bosham | National |
|---|---|---|
| Pupils working at age related expectation for RWM in 2023 | 64% | 59% |
| Pupils working at age related expectation for RWM in 2022 |
50% |
59% |
|
|
Bosham | National |
|---|---|---|
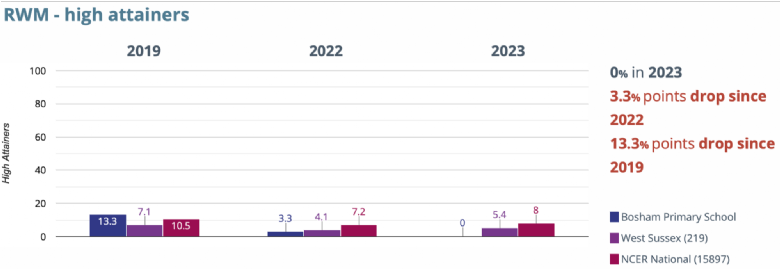
| Pupils working at greater depth for RWM in 2023 | 0% | % |
| Pupils working at greater depth for RWM in 2022 |
3% |
% |
|
|
Bosham | National |
|---|---|---|
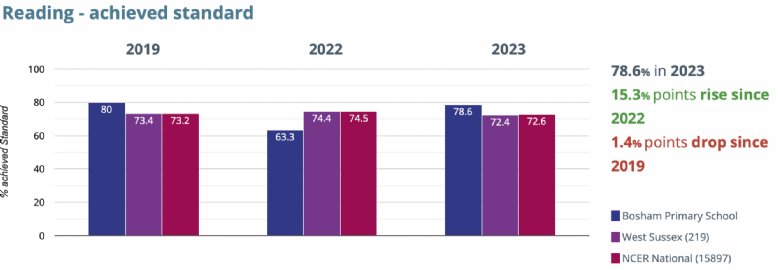
| Pupils working at age related expectation for reading in 2023 | 79% | % |
| Pupils working at age related expectation for reading in 2022 |
63% |
% |
|
|
Bosham | National |
|---|---|---|
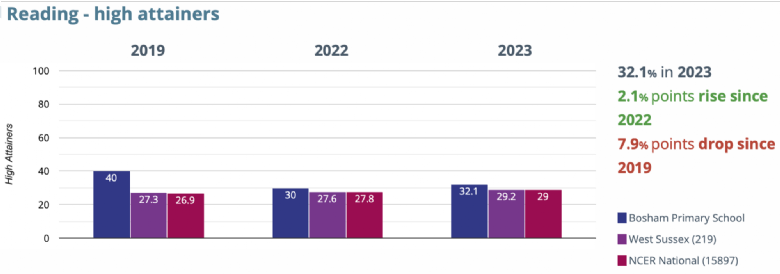
| Pupils working at greater depth for reading in 2023 | 32% | % |
| Pupils working at greater depth for reading in 2022 |
30% |
% |
|
|
Bosham | National |
|---|---|---|
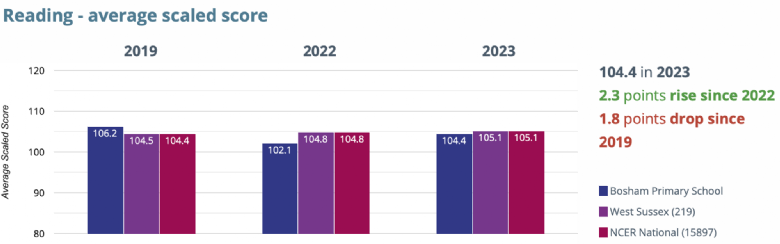
| Average scaled score for reading in 2023 | 104 | |
| Average scaled score for reading in 2022 |
102 |
|
|
|
Bosham | National |
|---|---|---|
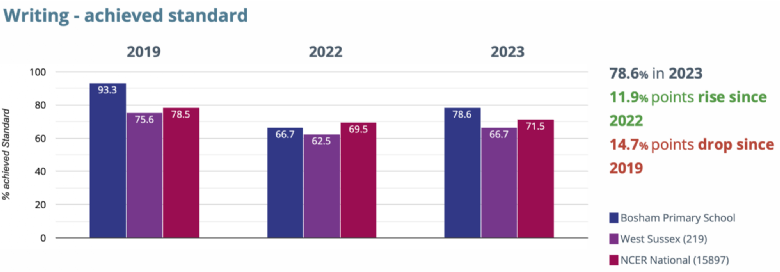
| Pupils working at age related expectation for writing in 2023 | 79% | % |
| Pupils working at age related expectation for writing in 2022 |
63% |
% |
|
|
Bosham | National |
|---|---|---|
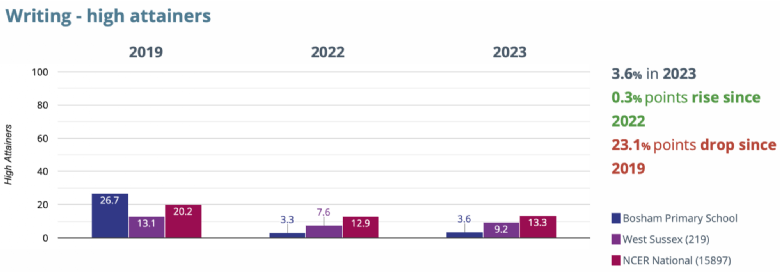
| Pupils working at greater depth for writing in 2023 | 4% | % |
| Pupils working at greater depth for writing in 2022 |
3% |
% |
There are no average-scaled scores for writing as this is assessed by the classroom teacher and not through statutory testing.
| Bosham | National | |
|---|---|---|
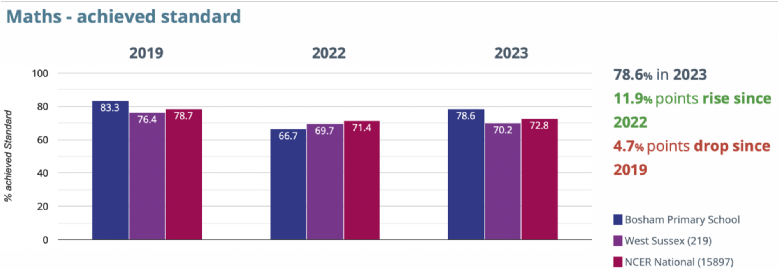
| Pupils working at age related expectation for maths in 2023 | 79% | % |
| Pupils working at age related expectation for maths in 2022 |
67% |
% |
|
|
Bosham | National |
|---|---|---|
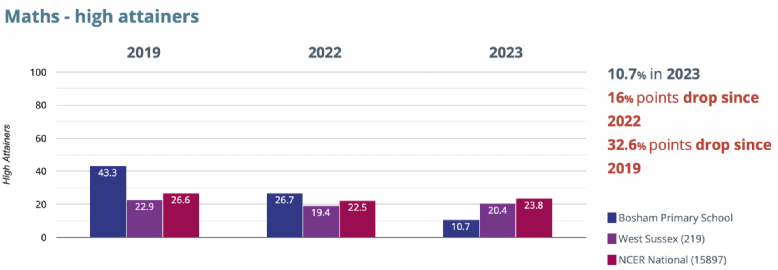
| Pupils working at greater depth for maths in 2023 | 11% | % |
| Pupils working at greater depth for maths in 2022 |
27% |
% |
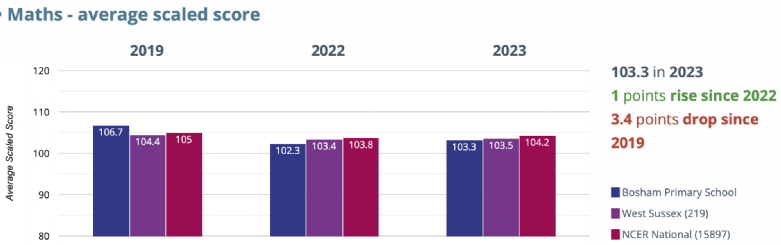
|
|
Bosham | National |
|---|---|---|
| Average scaled score for maths in 2023 | 103 | |
| Average scaled score for maths in 2022 |
102 |
|
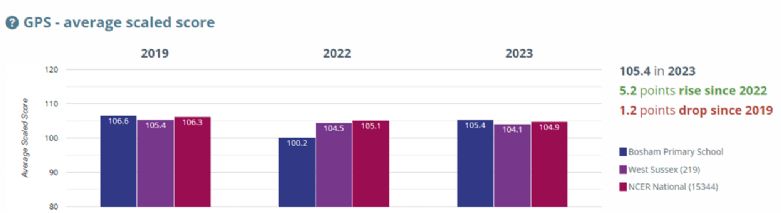
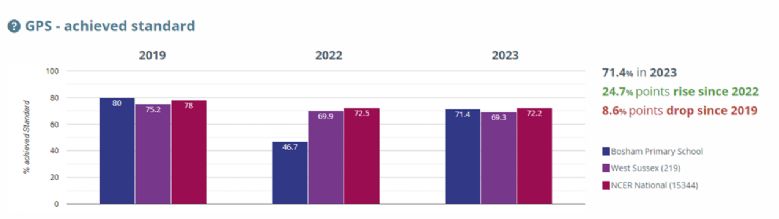
GPS = Grammar, punctuation & spelling
| Bosham | National | |
|---|---|---|
| Pupils working at age related expectation for GPS in 2023 | 71% | % |
| Pupils working at age related expectation for GPS in 2022 |
47% |
% |
|
|
Bosham | National |
|---|---|---|
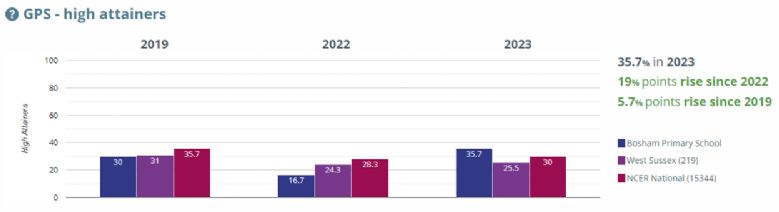
| Pupils working at greater depth for GPS in 2023 | 36% | % |
| Pupils working at greater depth for GPS in 2022 |
17% |
% |
|
|
Bosham | National |
|---|---|---|
| Average scaled score for GPS in 2023 | 105 | |
| Average scaled score for GPS in 2022 |
100 |
|